Update, August 2026: The administration has since named its first hard discount figure, 30% off a core basket, far deeper than the 10% modeled below. I ran the new number, and the new public record, in an update; the downloadable model now has a July 2026 Update tab. An adversarial re-audit of this model in August also corrected three of my April assumptions, and the table and charts below now show the corrected figures: school meals had been priced at the state's top-up cost rather than full public cost (that row falls from ~10× to ~1×), the FRESH row's cost and benefit sourcing tightened (30× becomes 2–8×), and my SNAP household count had used a survey-scale figure roughly a third below the administrative caseload. The reasoning is in the update's methodology notes.
I built a model to stress-test Mayor Mamdani's five city-owned grocery stores against the alternatives the same $100M could fund. The stores come in last on food delivered per public dollar. I think the model might be useful for city employees who want to maximize food affordability for low-income New Yorkers.
I'm sympathetic to the goal. Food access in the outer boroughs is a real problem, and the charitable read is that Mayor Mamdani wants to build a functional, physical monument to the idea that government can feed its people. In a moment where the monumental public construction of our time is a White House ballroom, that instinct isn't nothing.
The right question
Whether the stores break even is the wrong question. Libraries lose money. Parks lose money. Fire departments are not profit centers. The entire point of public provision is that some things are worth doing even when they can't pay for themselves — the whole society benefits. If a city-owned grocery store delivered meaningful nutrition to low-income New Yorkers, a $3M/year operating subsidy would be a bargain.
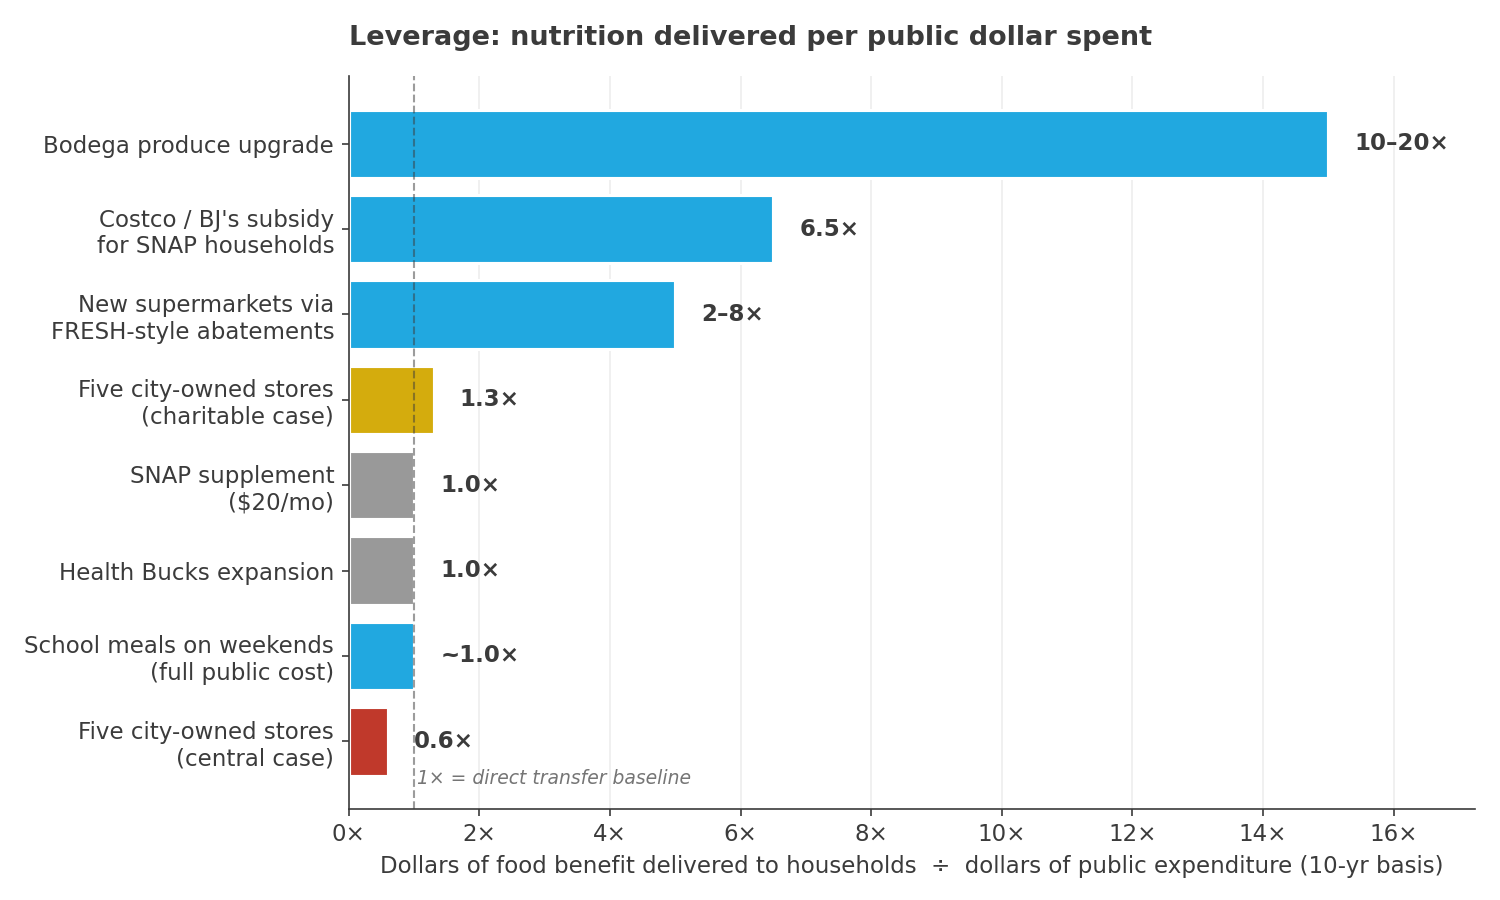
The right question is dollars of food-and-grocery benefit delivered to low-income households per dollar of public expenditure. Any food-access intervention can be scored on that metric. Some intervention has to win. The data have convinced me that this one is the lowest-leverage option available, by a wide margin. And that matters because the city has other, better options already on the shelf.
The spreadsheet below is downloadable; every assumption is a yellow cell. If you think a number is wrong, change it, and see where the conclusion moves.
Nutrition delivered per public dollar
Seven options, all normalized to the same 10-year public-cost envelope as Mayor Mamdani's plan: $100M total, made up of the $70M of announced capex ($30M for La Marqueta plus $40M across four retail conversions) and a $3M/yr operating subsidy carried for ten years. Some of these interventions have a natural scope larger than $100M (a SNAP supplement covering every eligible household runs about $1.0B; a Costco subsidy for every SNAP household about $695M); at $100M they reach a subset but the per-dollar leverage is identical. Full calculations and the natural-scope versions in the model's Alternatives tab.
| Intervention | 10-yr public cost | Households (HH) reached at $100M | Benefit / HH / yr | 10-yr food benefit | Leverage |
|---|---|---|---|---|---|
| Bodega produce upgrade (one-time grant + produce subsidy) | $100M | ~3.3M HH (citywide) | $30–60 realized | ~$1–2B | ~10–20× |
| New private supermarkets via FRESH-style abatements | $100M | ~143k half-mile low-access HH (~93 new stores) | ≈$300 (low-access core) | ~$430M | 2–8× |
| Expand school meals to weekends (full public cost) | $100M | ~12,700 kids | ≈$790 in meals | ~$100M | ~1.0× |
| Costco / BJ's subsidy for eligible SNAP households | $100M | ~108k HH (partial coverage) | $600 | ~$648M | 6.5× |
| Health Bucks expansion at participating markets | $100M | ~66k HH/yr | $150 | $100M | 1.0× |
| SNAP supplement ($20/mo for SNAP families with kids) | $100M | ~42k HH/yr | $240 | $100M | 1.0× |
| Five city-owned stores — central case | $100M | 90k shoppers | $67 | $60M | 0.6× |
| Five city-owned stores — charitable case (plan works as pitched) | $100M | 100k shoppers | $130 | $130M | 1.3× |
The FRESH row reserves the full ≈$300 access benefit for the low-income core of the low-access population (~32,000 households); the 2–8× range spans exactly that band. The bodega row's ~3.3M is the citywide household count, deduplicated from overlapping catchments, and its realized $30–60 nets the nominal $50–100 subsidy against uptake; details in the update's methodology notes.
A 1.0× leverage means every public dollar becomes a dollar of food benefit to a household. That's the honest floor for a direct-transfer program. Anything above 1.0× has some catalytic mechanism: private capital and access value (FRESH), volume discounts (warehouse memberships), or durable infrastructure with a multiplier on household behavior (bodega upgrade).
The five-store plan is the only intervention in this list that, in its central case, delivers less food benefit than it costs in public dollars. Even in the charitable case, where every optimistic assumption holds, it barely clears the floor that a direct transfer meets by design.
The five-store plan appears twice in the table because I modeled it two ways: a central case (0.6×) and a charitable case (1.3×). Why the roughly 2× gap between them? Both cost $100M. The gap is entirely in what reaches shoppers, driven by three compounding assumptions: reach (18k vs. 20k shoppers per store), spend at the store per shopper ($1,100 vs. $1,200/year, since a 9,000 sqft format can't carry a full basket), and realized discount (6% vs. 10%). The charitable case assumes every one of those holds at the better end; the central case is what happens when the unit economics push back.
Government-built grocery stores are low-leverage because too much of the money goes to construction and operating overhead, and little of it reaches shoppers as cheaper food.
Why the flagship capex is so high
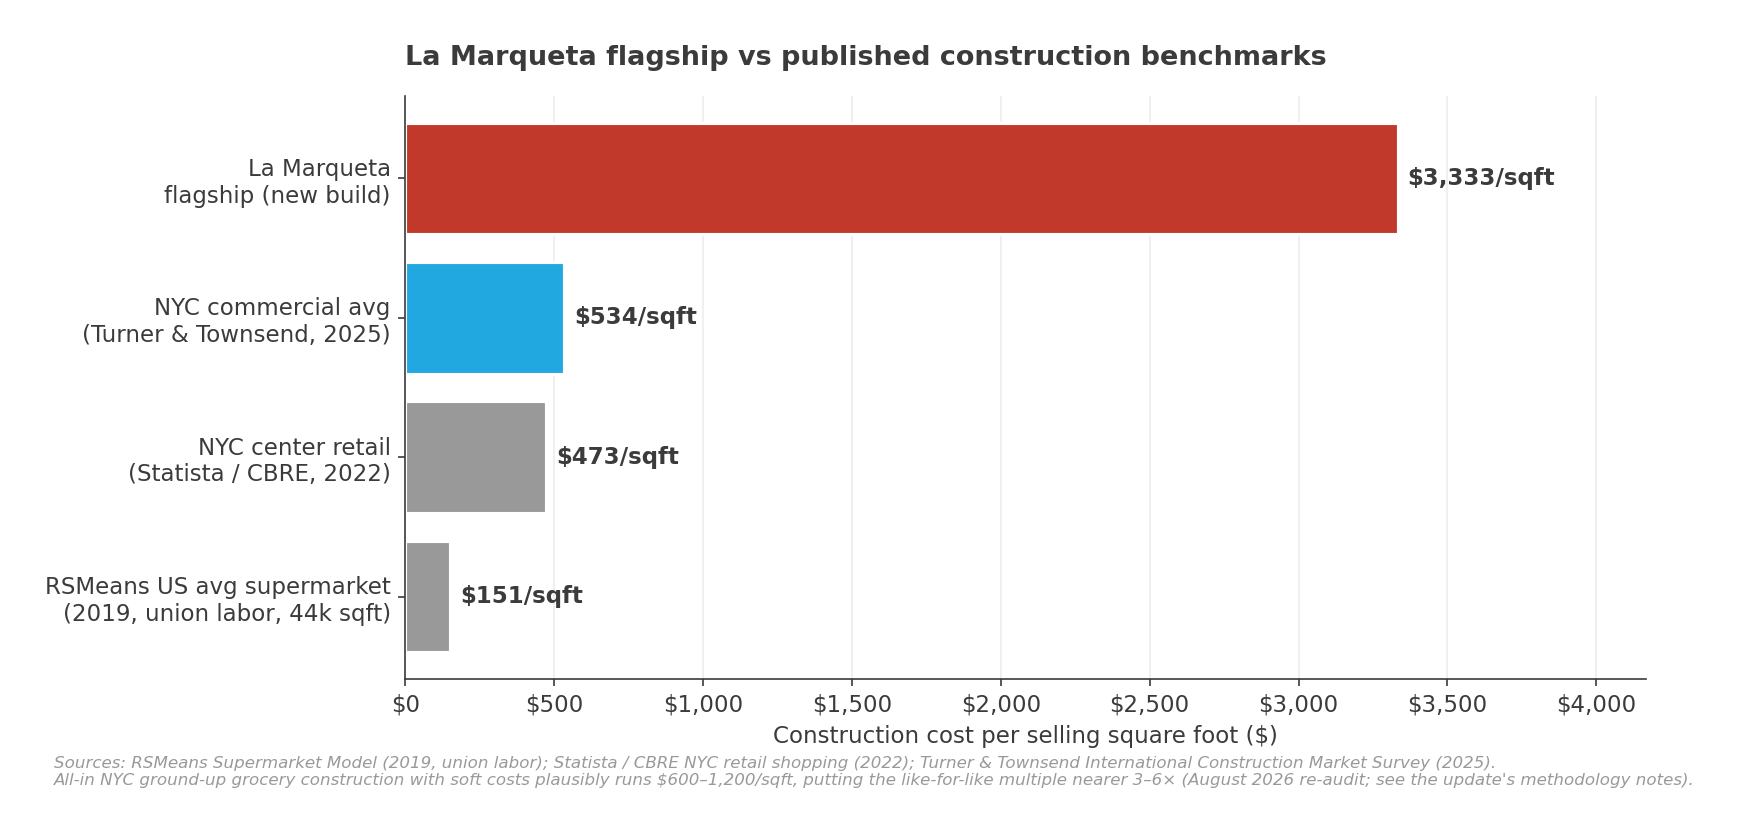
La Marqueta is budgeted at $30M of construction for 9,000 sqft of selling space. That's $3,333 per square foot.
Three publicly cited benchmarks for comparison:
- RSMeans supermarket model (2019, 44,000 sqft, US national average, union labor): $151/sqft
- NYC center retail shopping (Statista / CBRE, 2022): $473/sqft
- NYC commercial new-build, all types (Turner & Townsend 2025 Intl. Construction Market Survey, which notes NYC is the most expensive city in the world to build in): $534/sqft
La Marqueta is 6–22× those benchmarks on their face — though the benchmarks flatter the comparison. All-in NYC ground-up grocery construction, with soft costs, plausibly runs $600–$1,200/sqft, and a premium NYC small-format build like a Whole Foods Daily Shop runs $600–$800/sqft, which puts the honest like-for-like multiple closer to 3–6×. La Marqueta's cost reflects the restoration of a LaGuardia-era public market under the Metro-North viaduct, with prevailing wage, public bidding, design review, and site-driven structural work.
The other four stores are a different story. The administration has said they will convert existing retail spaces rather than build from scratch; the first to open (late 2027) will be in an existing building in a not-yet-named borough. That's a materially smarter play than five ground-up monuments: conversions mean lower capex per store, faster openings, and inherited infrastructure. Per-store figures haven't been disclosed.
So the capex critique is narrower than it looks. La Marqueta is the outlier, soaking up 43% of the capital budget for one of five stores. The other four are being handled with reasonable pragmatism.
Why the operating structure undercuts the pitch
Here's the operating model for a single 9,000 sqft store at FMI's industry-average sales per square foot (a generous assumption for a new small-format municipal store), with the modeled 10% discount and otherwise standard industry costs:
| Line | $ |
|---|---|
| Gross revenue (9,000 sqft × $965/sqft) | $8.7M |
| Less 10% shopper discount | ($870k) |
| Net revenue | $7.8M |
| Cost of goods sold (COGS) — 72% of gross, FMI 2024 avg | ($6.3M) |
| Labor (12% of gross, NYC prevailing wage) | ($1.0M) |
| Other opex — ex rent (9% of gross) | ($780k) |
| Private operator fee | ($400k) |
| Rent savings (memo only — city-owned land) | ~$450k avoided |
| Operating result | ~$660k LOSS |
The operating loss isn't the problem. Lots of public services run at a loss. The problem is what the loss means for how many dollars of the discount actually reach shoppers.
The grocery industry runs on a ~1.6% net margin. A 10% shopper discount wipes that out six times over. The Sensitivity tab shows the mechanical consequence: at 10% discount with standard industry costs, no sales-per-square-foot produces a profit. At realistic $400–$600/sqft for a small-format store, each location loses roughly $500–$560k/year in steady state.
That forces one of three outcomes:
- The discount shrinks below the 10% modeled here, probably to 3–7% in practice. The benefit to shoppers is a fraction of what was promised.
- The operating subsidy grows: the city absorbs the gap. Plausible, but it compounds public-dollar cost without reaching more households.
- The store reduces assortment or service to cut labor and overhead, which erodes traffic, which erodes revenue, which erodes the discount.
All three paths lead to the same place: the net food benefit reaching shoppers is smaller than the pitch implies. Most of the $70M capex buys construction; most of the operating subsidy buys overhead. The thin layer of benefit that reaches shoppers is a discount on groceries they were already buying, on a partial assortment, at the one store out of five they can physically get to.
Municipal grocery precedents back this up. Kansas City's Sun Fresh burned through ~$20M of public money and closed in 2025. Baldwin, FL closed after five years. Chicago backed away from the same model last year. St. Paul, KS survives, in a town of 600 people.
Sanity check: who this plan is supposed to help
Imagine a single parent in West Farms, the Bronx — $40k income, two kids, a short walk from the Bronx Zoo. She's exactly who good food policy should help: stretched budget, limited time, no car, and a neighborhood where she has grocery options but none of them are great.
Her budget math:
- Take-home + tax credits: about $33,400/year after federal, FICA, NY state, and NYC local tax, plus $7,500 in EITC/CTC as a tax-time lump sum. Roughly $3,400/month smoothed.
- SNAP: she's just above the 2026 3-person gross-income limit of $33,575/year. No SNAP.
- School meals: NY's universal free breakfast and lunch cover both kids during the school year, worth about $165/month per child.
- Housing: median Bronx 2BR at market is $2,800–$3,700/month, which exceeds her entire take-home. The household only works with rent-stabilized, NYCHA, or Section 8 housing at roughly $1,100–$1,300/month.
- Other fixed costs: about $500/month for utilities, transit, phone.
That leaves $700–$900/month for food, which matches the 2025 USDA Thrifty Food Plan for a mother and two school-age kids (about $750/month). She can just about hit it.
Her grocery landscape:
- There is no Whole Foods in the Bronx. The nearest is on 125th St in Harlem, a 35–45 minute trip by 2 or 5 train.
- BJ's Wholesale Club is in the Bronx, at Bronx Terminal Market — about 20–25 minutes from West Farms on the 2 or 5 train. Realistic as a bulk-shopping trip every few weeks, if she can carry what she buys home on the subway.
- Costco is in East Harlem, about 35–40 minutes away. Warehouse-club prices run roughly 20–35% below typical supermarkets (Consumers' Checkbook and Consumer Reports basket studies), call it $800–$1,200/year for a full-basket shopper at typical spend; without a car she can realistically only move a partial basket — more like $400–$700/year in realized savings.
- Day-to-day: Fine Fare, Pioneer, Food Bazaar, a local Aldi, and lots of bodegas.
Not a food desert, but not great. The binding constraints for this household aren't grocery sticker prices. They are housing cost (by a wide margin), the SNAP benefits cliff (she loses about $500/month the day her gross income crosses $33,575), time and storage (small apartment, one caregiver, no car, hard to buy in bulk even if she can get to BJ's), and physical access to a full-format store for shoppers in parts of the borough that aren't near a BJ's or a subway.
What would dramatically improve her life isn't a 5–10% discount at a store she can't easily get to. It's a great fresh-food place at market prices a ten-minute walk from her apartment — the exact thing the FRESH tax abatement program catalyzes private operators to build. Or the bodega she already walks past stocking real fresh produce because the city subsidized the cold chain. Or her kids getting breakfast and lunch on weekends, when school meals stop. Or a SNAP system that doesn't penalize her for earning $40k instead of $33,575. All of these scored in the leverage table above.
Where I land
La Marqueta has precedent: LaGuardia opened it as a public market in 1936. The "private operator on city-owned land" structure is a sensible compromise between full municipal ownership and a pure tax abatement. If Donald Trump is spending $400M on a ballroom, there's something quaintly defiant about Mayor Mamdani building grocery stores for the hungry.
But the question isn't whether this is a worthy idea; it's whether it's the best use of $100M of public capital aimed at feeding low-income New Yorkers. On the only metric that matters (food benefit delivered per public dollar), five city-owned grocery stores come in last. Every other option clears 1× by design, and the best reach ten to twenty times the floor.
We have a wonderful opportunity to spend $100M, in the greatest city in the world, feeding the poor.
We all have a responsibility to do the best we possibly can with every one of those dollars.
That's why the spreadsheet is downloadable. If you can change an assumption and make the plan pencil against its alternatives — or find a cheaper path to more meals that I missed — I genuinely want to know.
Notes on uncertainty
Numbers with the widest honest range:
- Revenue per sqft for a new small-format municipal store: $400–$965. No value in that range produces a profit at a 10% shopper discount.
- NYC labor cost as a % of gross revenue: 10–14% (12% central case).
- Realized shopper discount after operator fees and purchasing-scale gaps: 5–10% (our assumption; the plan had named no figure when this was built).
- Per-household benefit estimates in the alternatives table: every row is a yellow cell you can overwrite. The plan's last-place position is stable against fairly wide swings; the ordering among the alternatives moves within their stated ranges.
If any of those move meaningfully in the plan's favor, the conclusion narrows but doesn't reverse. The plan stays below the leverage of every direct-transfer alternative in realistic scenarios.
If you find something wrong, tell me. joe@group17a.com.
Sources
Full source list in the model's Sources tab. Key ones:
- Mayor Mamdani, La Marqueta press release (April 14, 2026); NYCEDC program page ($30M La Marqueta capital figure)
- FMI, 2024 Food Industry Facts (sales per sqft, net margin, store size distribution)
- USDA Thrifty Food Plan, 2025 monthly cost of food reports
- NYS OTDA / NYC HRA, SNAP caseload statistics (2025)
- NYC Comptroller, Good Jobs and the New York City FRESH Program (Fiscal Note 4-2024, October 2024)
- NY Department of Labor, 2026 prevailing wage schedules
- Macrotrends, Kroger and Costco net margin history
- Governor Hochul, Universal School Meals enactment
- NYC Food Policy Center, East Harlem food environment data
- Kansas City Sun Fresh closure (KCUR, 2025); Baldwin FL municipal grocery closure (Action News Jax); Chicago municipal grocery shelved (Supermarket News, 2024)
- Construction cost benchmarks: RSMeans Supermarket Model (rsmeans.com/model-pages/supermarket); Turner & Townsend 2025 International Construction Market Survey; Statista NYC retail shopping construction cost data (2022, CBRE-derived)
- Bronx grocery geography: Whole Foods Market store locator (confirms no Bronx locations); BJ's Wholesale Club (610 Exterior St, Bronx); Costco East Harlem (517 E 117th St)